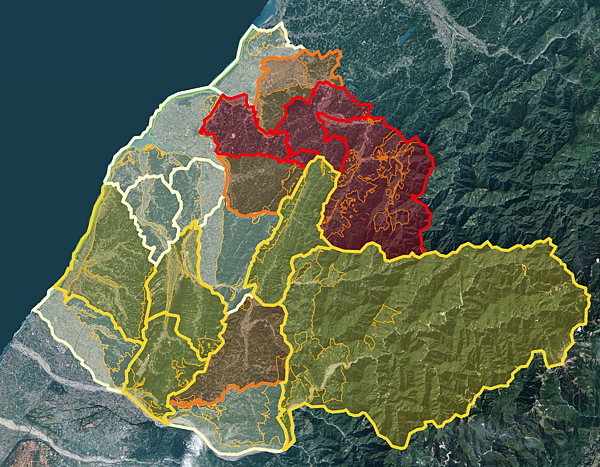
利用GeoJson動態產生面量圖
若要在google map圖台上要呈現不同區域的面量圖
除了可以用先製作好的kml/kmz之外
也可以動態產生kml來套疊
但若遇到製成的kml檔案太大時候
就會無法呈現
原因是出在google map無法載入太大的kml檔案
因此我用GeoJson方式套疊,效能跟檔案大小都輕量許多
用法跟ajax非同步傳遞很類似
以下為javascript套疊語法
function createFeatureLayer(parameters, boundary) {
map.data.loadGeoJson("./Handler/HandlerFeatureLayer.ashx" + '?' + $.param(parameters) + '&boundary=' + boundary);
map.data.setStyle(function (feature) {
return {
strokeColor: 'rgba(' + feature.getProperty('color') + ',1)',
fillColor: 'rgba(' + feature.getProperty('color') + ',0.1)',
strokeWeight: 5
}
});
}
主要是 map.data.loadGeoJson 這句語法
裡面可以接先製成好的.json
或是像我這裡用的泛型處理,動態生成json
載入完json後
再設定style,map.data.setStyle
feature為回傳的json物件
strokeColor為邊框的顏色
fillColor為填滿的顏色
strokeWeight為線條粗細

json格式簡化如下
properties裡面的元素可以依照自己需求調整
{
"features": [
{
"type": "Feature",
"geometry": {
"type": "Polygon",
"coordinates": [
[
[
120.9508821135697,
24.600837419983996
],
[
120.9490643005697,
24.601238129984004
],
[
120.9508821135697,
24.600837419983996
]
]
]
},
"properties": {
"county": "苗栗縣",
"town": "獅潭鄉",
"color": "244,211,46"
}
},
{
"type": "Feature",
"geometry": {
"type": "Polygon",
"coordinates": [
[
[
121.21765261156973,
24.511683776983965
],
[
121.21752128156969,
24.514127147983992
],
[
121.21541794656967,
24.515486625983975
]
]
]
},
"properties": {
"county": "苗栗縣",
"town": "泰安鄉",
"color": "244,211,46"
}
}
],
"type": "FeatureCollection"
}


留言
張貼留言